- English
- Indonesia
Published by I Putu Arka Suryawan at Tue May 27 2025

Have you ever sat in a meeting where a data scientist presented findings that sounded like they were speaking in code? You're not alone. The gap between technical data analysis and business understanding is one of the biggest challenges organizations face today. But here's the good news: you don't need a PhD in statistics to make sense of data and use it to drive better business decisions.
The disconnect between data scientists and business professionals isn't about intelligence—it's about language. Data scientists live in a world of algorithms, statistical significance, and technical jargon. Business professionals focus on outcomes, growth, and practical solutions. Neither perspective is wrong, but they often don't translate well between each other.
Think of it like having a brilliant chef and a hungry customer who don't speak the same language. The chef knows exactly how to create amazing dishes, but if they can't communicate what makes each dish special, the customer might miss out on the best options.
This communication gap costs businesses more than just confusion. It leads to:
The first step in bridging this gap is establishing a shared vocabulary. You don't need to become a statistician, but understanding key concepts will make conversations more productive.
Instead of getting lost in technical terms, focus on the business meaning behind the data. When a data scientist mentions "correlation," ask yourself: "What does this relationship mean for our customers?" When they discuss "confidence intervals," think: "How certain can we be about this decision?"
Here's a practical approach: create a simple translation document for your team. List common data terms alongside their business implications. For example, "statistical significance" might translate to "we can trust this result enough to make decisions based on it."
Remember, the goal isn't to become a data scientist yourself. It's to become fluent enough in their language to guide the conversation toward business value.
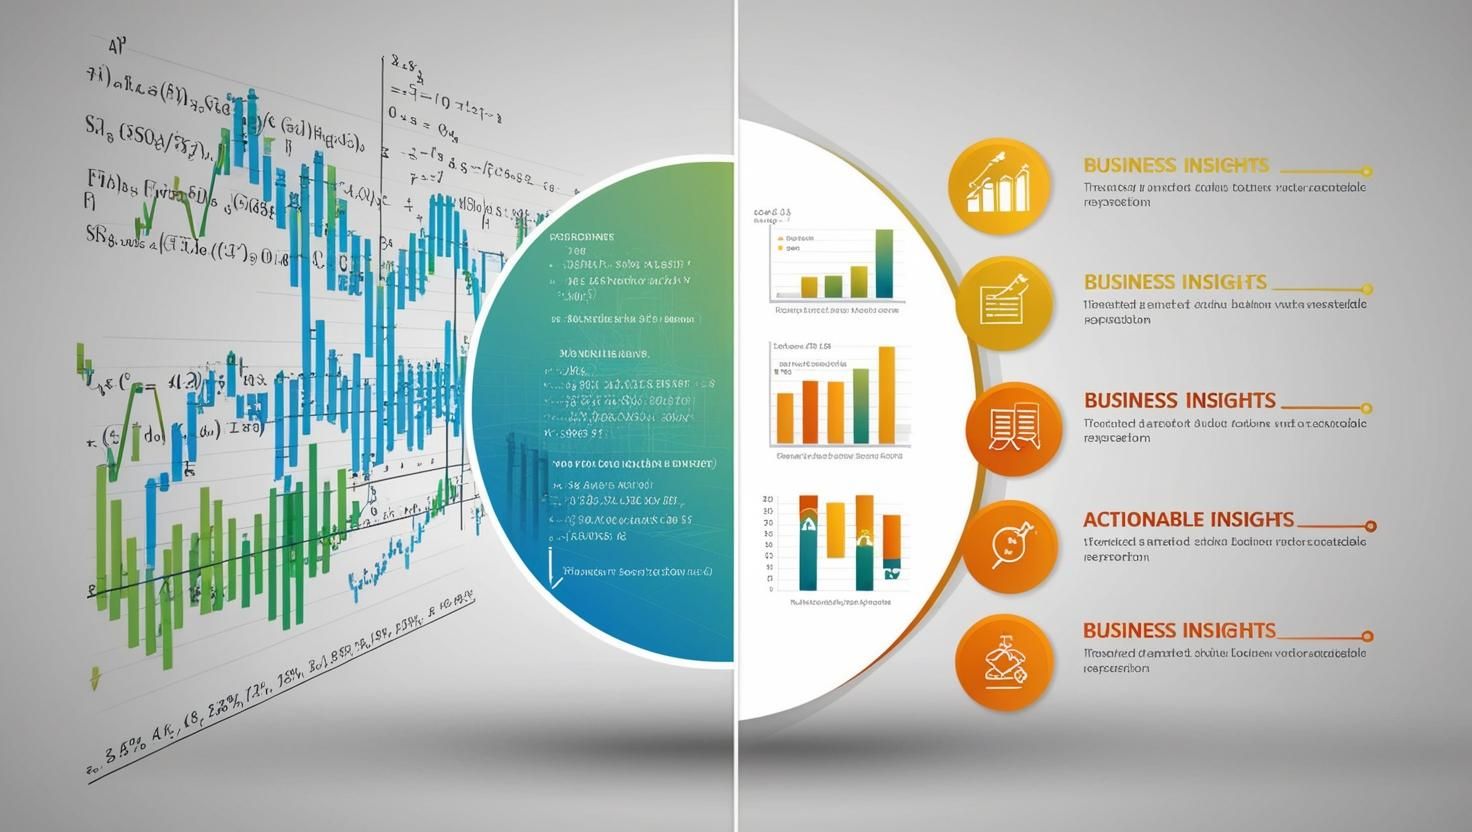
Visual data storytelling is your secret weapon for understanding complex analysis. The right chart can make the difference between confusion and clarity, between data and insight.
Start with the basics: bar charts for comparisons, line graphs for trends over time, and scatter plots for relationships between variables. But don't stop there. Ask your data team to create visualizations that speak directly to your business questions.
For instance, instead of a complex statistical model output, request a simple before-and-after comparison showing how a marketing campaign affected sales. Rather than correlation matrices, ask for charts that show which customer behaviors predict higher lifetime value.
The most effective visualizations tell a story. They should have a clear beginning (the current situation), middle (what the data reveals), and end (what action to take). If you're looking at a chart and can't immediately understand what decision it's helping you make, ask for a simpler version.
Color and design matter too. Use consistent colors across all your reports, highlight the most important data points, and always include clear labels. Your future self (and your colleagues) will thank you.
Learning to interpret data results is like developing a new sense. At first, everything might seem overwhelming, but with practice, patterns become clearer and insights more obvious.
Start by asking the right questions. Instead of "What does this data show?" try "What decisions can we make based on this data?" This shifts the focus from technical details to business value.
Pay attention to context. A 10% increase in website traffic might be excellent if it happened during a slow season, but concerning if it occurred during your biggest marketing push of the year. Always ask: "Compared to what?" and "Why might this be happening?"
Look for trends, not just snapshots. A single data point tells you very little, but a series of data points can reveal powerful insights about direction and momentum. Is customer satisfaction improving over time? Are costs trending upward? These patterns matter more than individual measurements.
Don't be afraid to question surprising results. If the data shows something that contradicts your business experience, dig deeper. Either you'll discover a valuable insight you hadn't considered, or you'll uncover a data quality issue that needs addressing.
The ultimate goal of any data analysis is action. Raw data, even beautifully visualized, has no value until it drives better decisions and improved outcomes.
Transform findings into recommendations by connecting data patterns to specific business actions. If customer support tickets spike every Monday, what operational changes could smooth that peak? If certain product features correlate with higher retention, how can you emphasize those features in your marketing?
Create a simple framework for turning insights into action plans. For each significant finding, ask: What does this mean for our business? What should we do differently? Who needs to be involved? What's the expected impact? When should we reassess?
Document your insights and actions. Create a simple tracking system that shows which data-driven decisions you've made and their outcomes. This builds confidence in your analytical approach and helps you refine your process over time.
Remember, not every insight requires immediate action. Some data simply confirms what you already knew, which is valuable too. Others might suggest experiments rather than major changes. The key is being intentional about how you respond to what the data tells you.

Bridging the gap between data science and business isn't a destination—it's an ongoing journey. Start small, be patient with yourself, and celebrate progress along the way.
Begin by identifying one business question you'd like data to help answer. Work with your data team to explore that question together, focusing on understanding rather than just getting results. Use this experience to build your confidence and communication skills.
As you become more comfortable with data, you'll find yourself asking better questions, making more informed decisions, and seeing opportunities others might miss. You'll become a translator between the technical and business worlds, adding tremendous value to your organization.
The future belongs to businesses that can effectively combine human insight with data intelligence. By developing your ability to work with data without becoming overwhelmed by its complexity, you're positioning yourself and your organization for success in an increasingly data-driven world.